Trading TSLA After the 20% Surge: Historical Patterns and Options Strategies
Last Thursday, TSLA jumped around 20% after the earnings call.
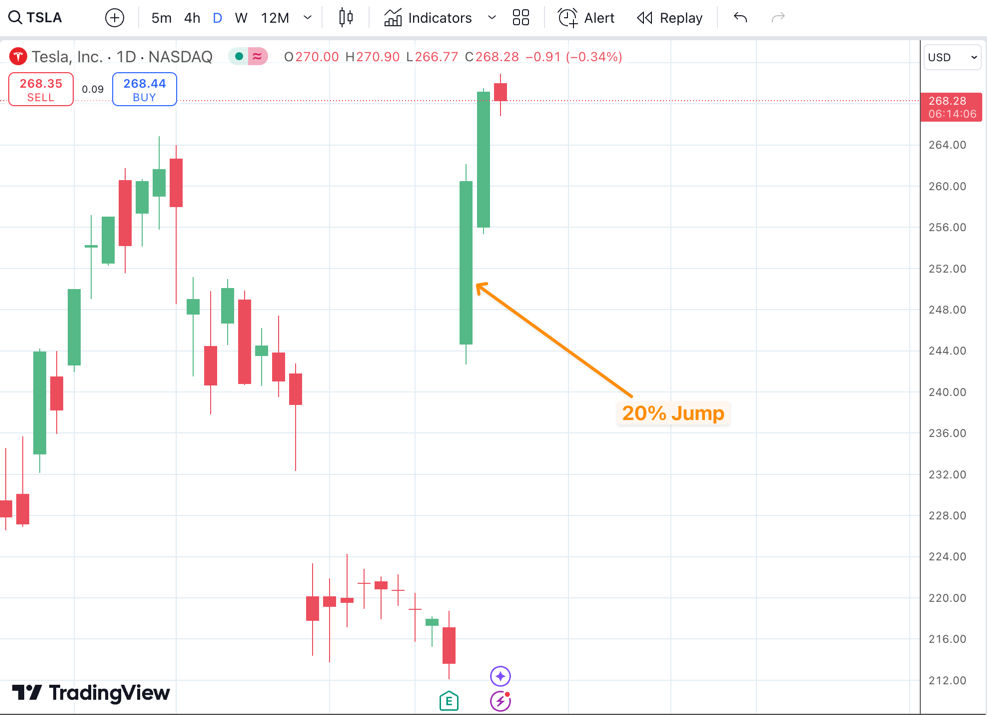
I think there may be an opportunity for a trade due to this extreme movement. So I looked into the number of times when there was a significant jump and then what happened afterwards.
There are around 9 occasions where TSLA jumped more than 15% in a day, including the one that happened last week.
| Date | Jump Day Gain | Next 7 Days Return |
|---|---|---|
| 2018-08-02 | 16.19% | 1.97% |
| 2018-10-01 | 17.35% | -17.32% |
| 2019-10-24 | 17.67% | 5.94% |
| 2020-02-03 | 19.89% | -1.63% |
| 2020-03-19 | 18.39% | 17.42% |
| 2020-03-24 | 16.28% | -10.01% |
| 2021-03-09 | 19.64% | -3.03% |
| 2024-04-29 | 15.31% | -9.96% |
| 2024-10-24 | 21.92% | Not Available |
There is only one occasion (March 19, 2020) when the stock jumped another 17% after the 18% rise in a single day.
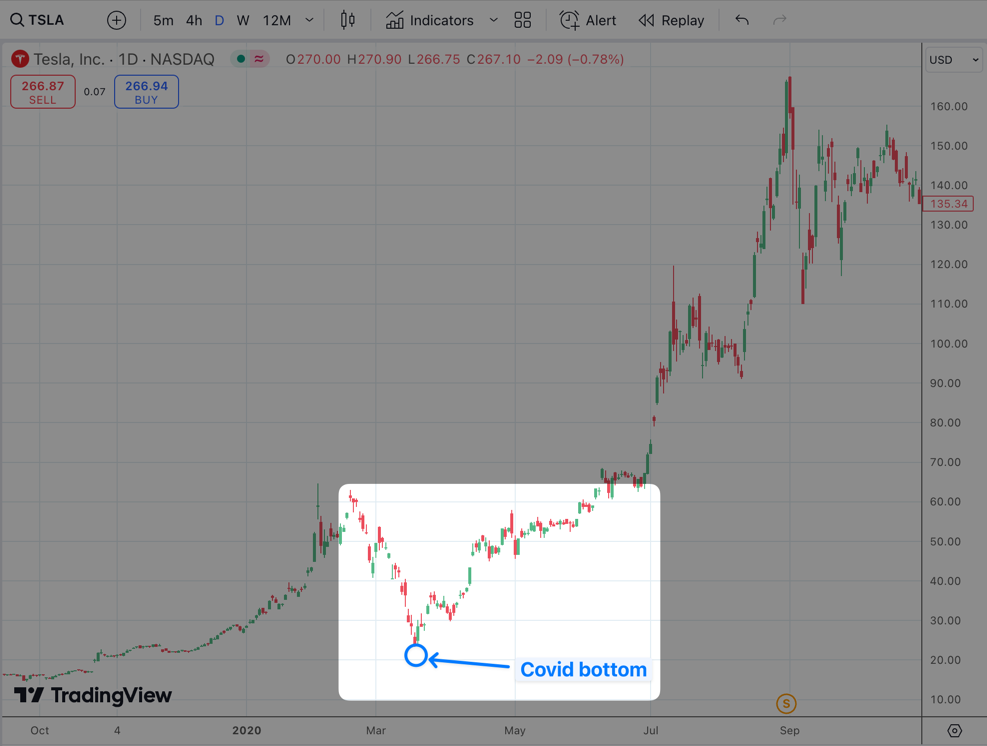
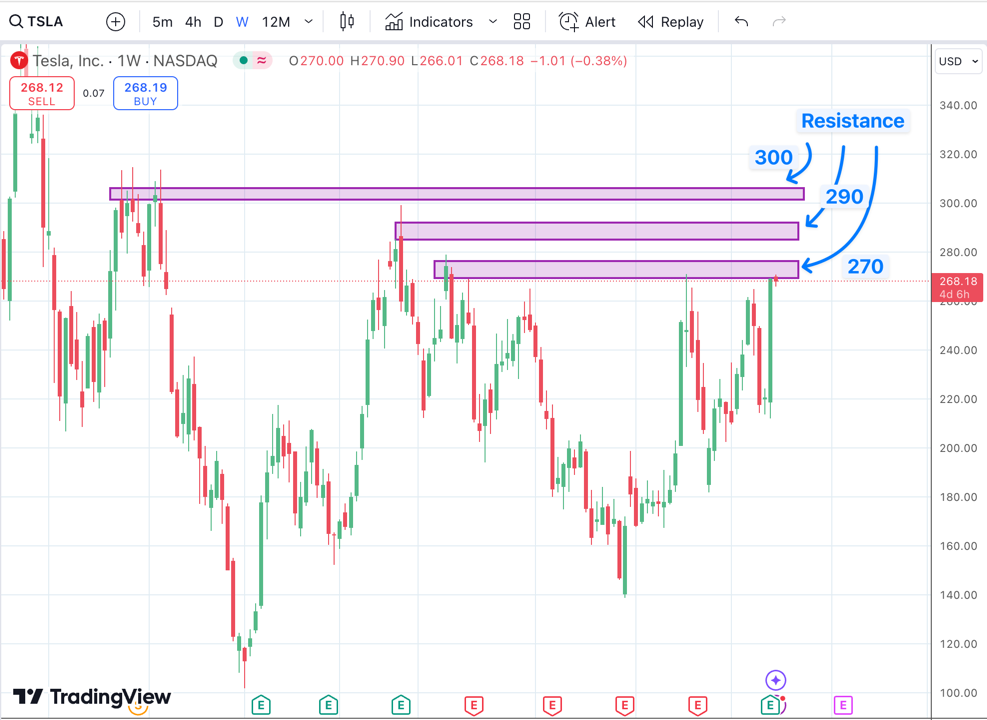
Now, the trading plan is to sell calls in anticipation that the stock won’t go up significantly after this jump.
There seem to be some headwinds ahead on the way up
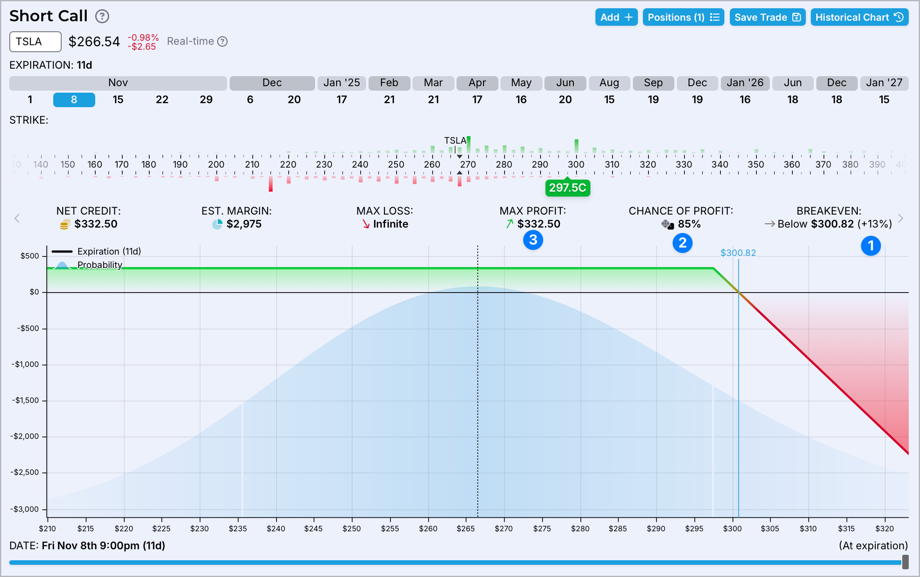
First idea to sell naked calls
A buffer for another 13% jump over the next 2 weeks with a delta of around 15%. Max profit ~297
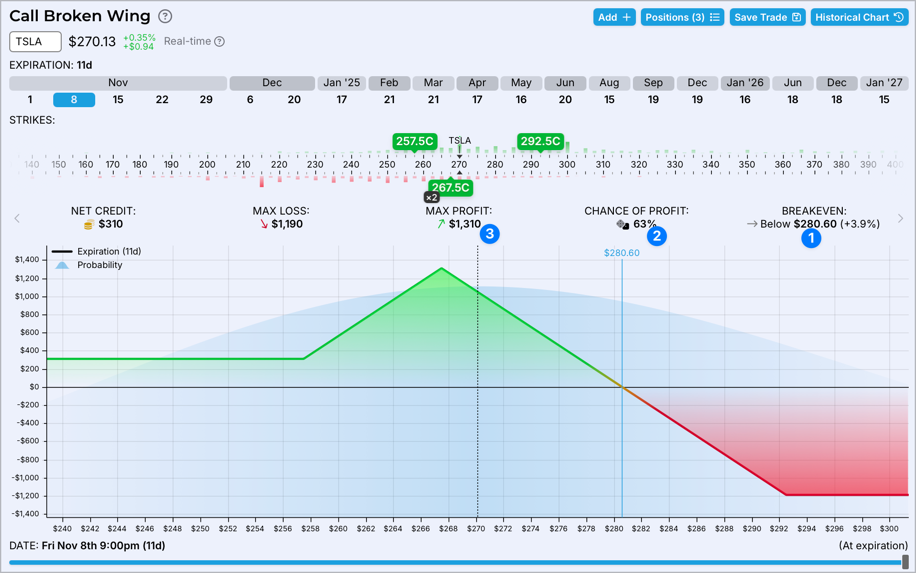
A defined risk trade
Less buffer on the upside but better profit potential if the stock goes down a little.
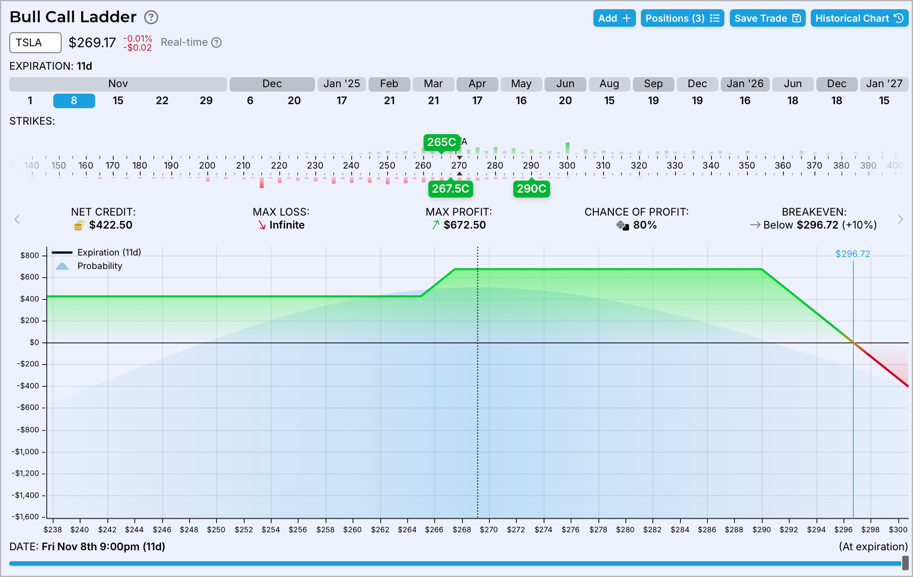
A Bull Call Ladder which gives us a lot of room (around 10%) and better profit potential
Disclaimer: This analysis is for educational purposes only and should not be considered as financial advice. Options trading involves significant risks and may not be suitable for all investors. Past performance is not indicative of future results. Always conduct your own research and consider consulting with a financial advisor before making any investment decisions.