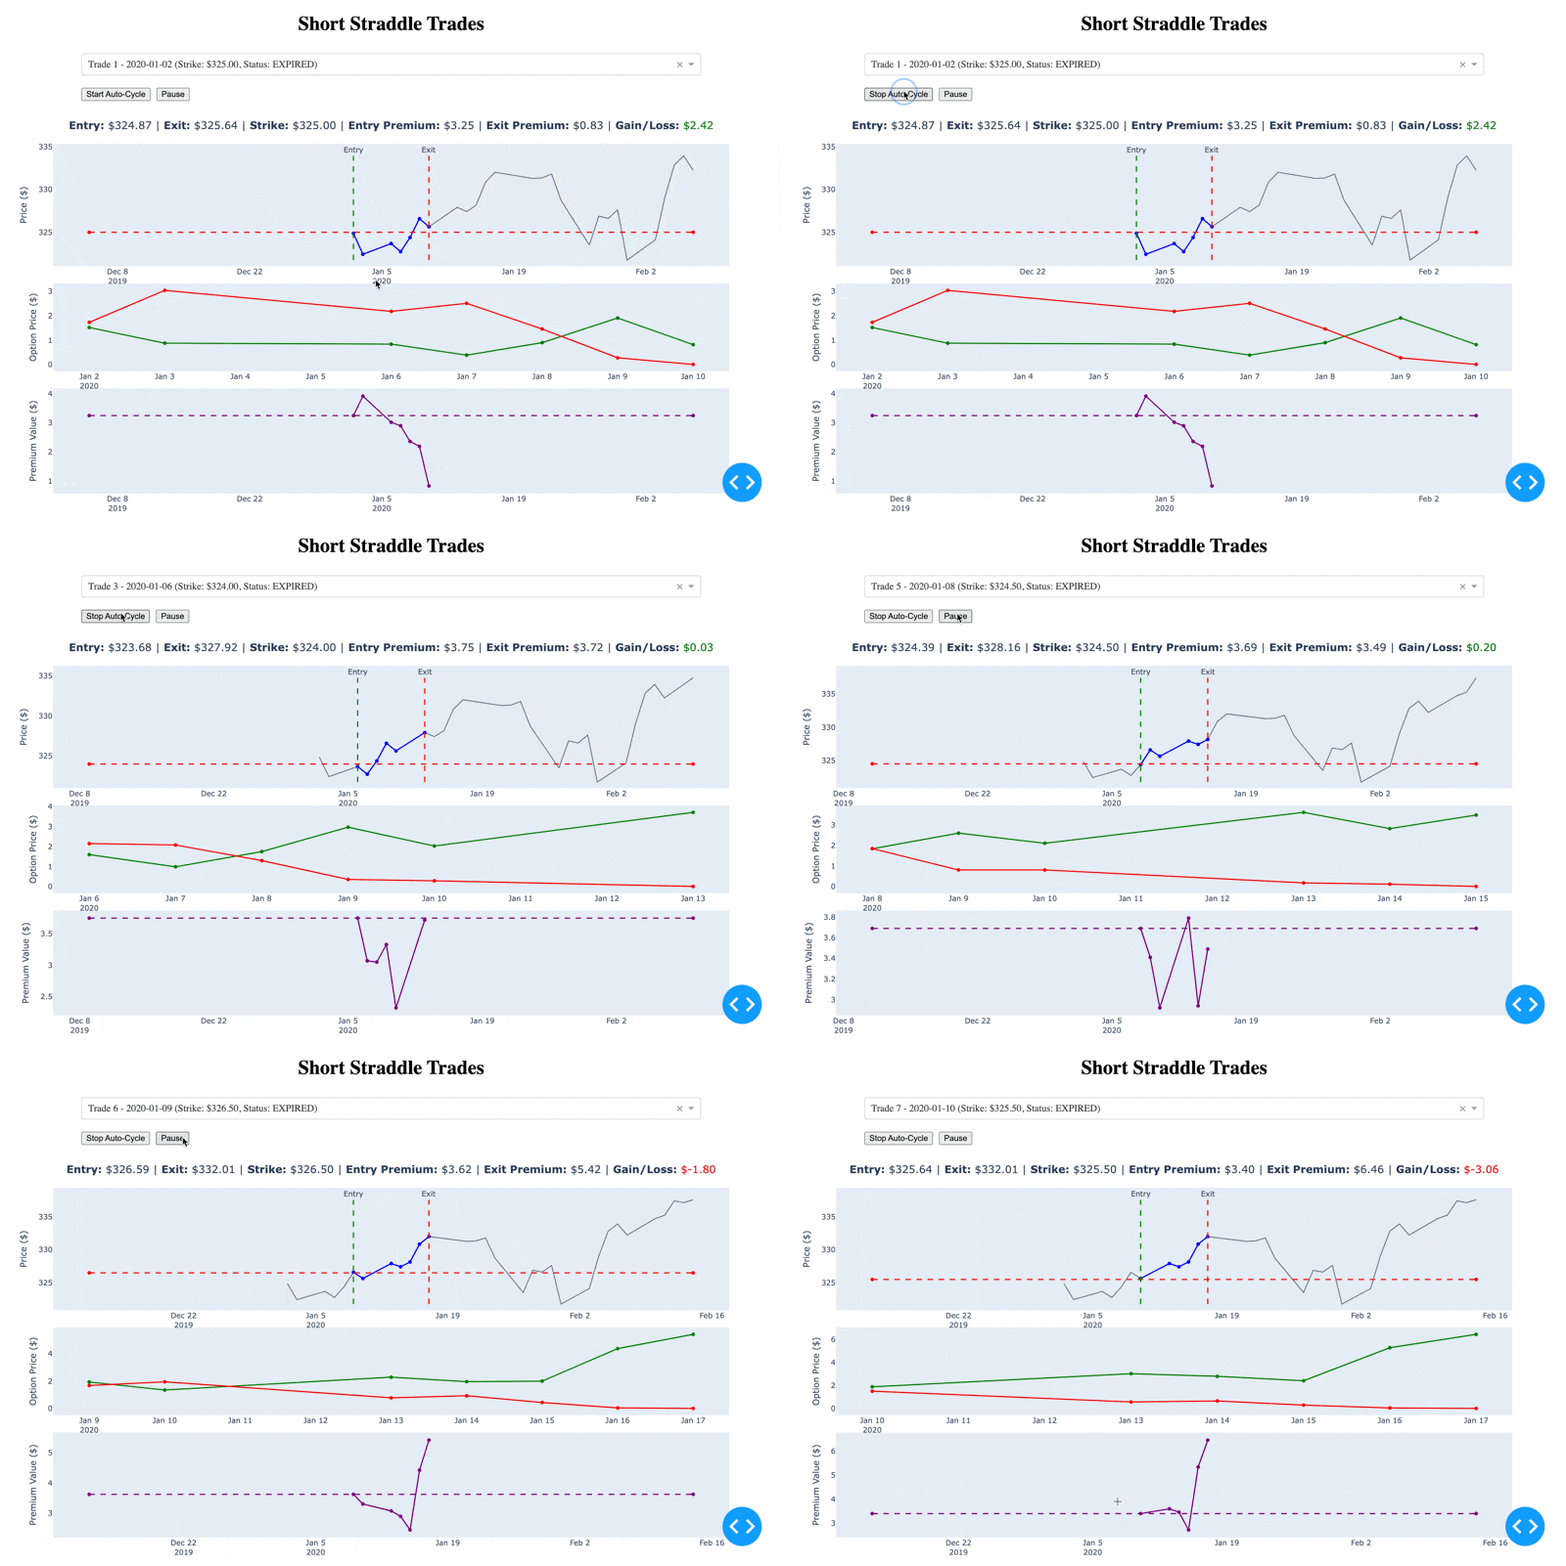
Analysing a very simple Short Straddle strategy
Gather data
The Options data is retrieved from optionsdx. This page documents the field definitions
The downloaded files will be zipped, so extract them into a single directory. It’ll look something like this:

Import data
Use the optionsdx-data-importer.py script to import all the data in an SQLite database
$ uvr optionsdx-data-importer.py --input $(pwd)/data/spy_eod --output data/spy_eod.db -v
The finished database will have an options_data table with all the data from the downloaded files.

Simple Straddle Strategy
A simple short straddle strategy is provided where a new straddle is placed every day with 7 DTE. The straddle is not managed, and we calculate the final price after 7 DTE as the closing price.
Run the options-straddle-simple.py script to simulate the strategy.
$ uvr options-straddle-simple.py --db-path data/spy_eod.db --dte 7
It’ll update the same database with two more tables.

The trades table contains each trade with opening and closing premium.
The trade_history table contains the trade period and daily premium prices for the selected strike.
Reporting
There are a couple of ways to analyse trade data. You can directly run SQL query against the database.
Here is an SQL query to report the monthly premium difference (premium collected at open - paid back at close)
SELECT
    STRFTIME('%Y-%m', ExpireDate) AS Month,
    SUM(PremiumCaptured) AS TotalPremiumCaptured,
    SUM(ClosingPremium) AS TotalClosingPremium,
    SUM(PremiumCaptured - ClosingPremium) AS TotalPremiumDifference
FROM trades
GROUP BY Month
ORDER BY Month;
Quickly visualising the data with DataGrip

The other way is more interactive and takes the user through the journey of each individual trade. It is an application built with the dash framework
Run the options-straddle-simple-report.py script to start the application.
uvr options-straddle-simple-report.py --database data/spy_eod.db --weeks 4
Once started, you can click on the link displayed in the console. You can visit this link assuming that it is running on the default port.

The chart is interactive when running, so select different trades or click on highlighted dots to see data at the point.
You can also cycle through trades automatically by clicking on the Start Auto Cycle button.
