Short Straddles with RSI based market filters
Hypothesis: What if we avoid new trade if RSI is overbought or oversold?
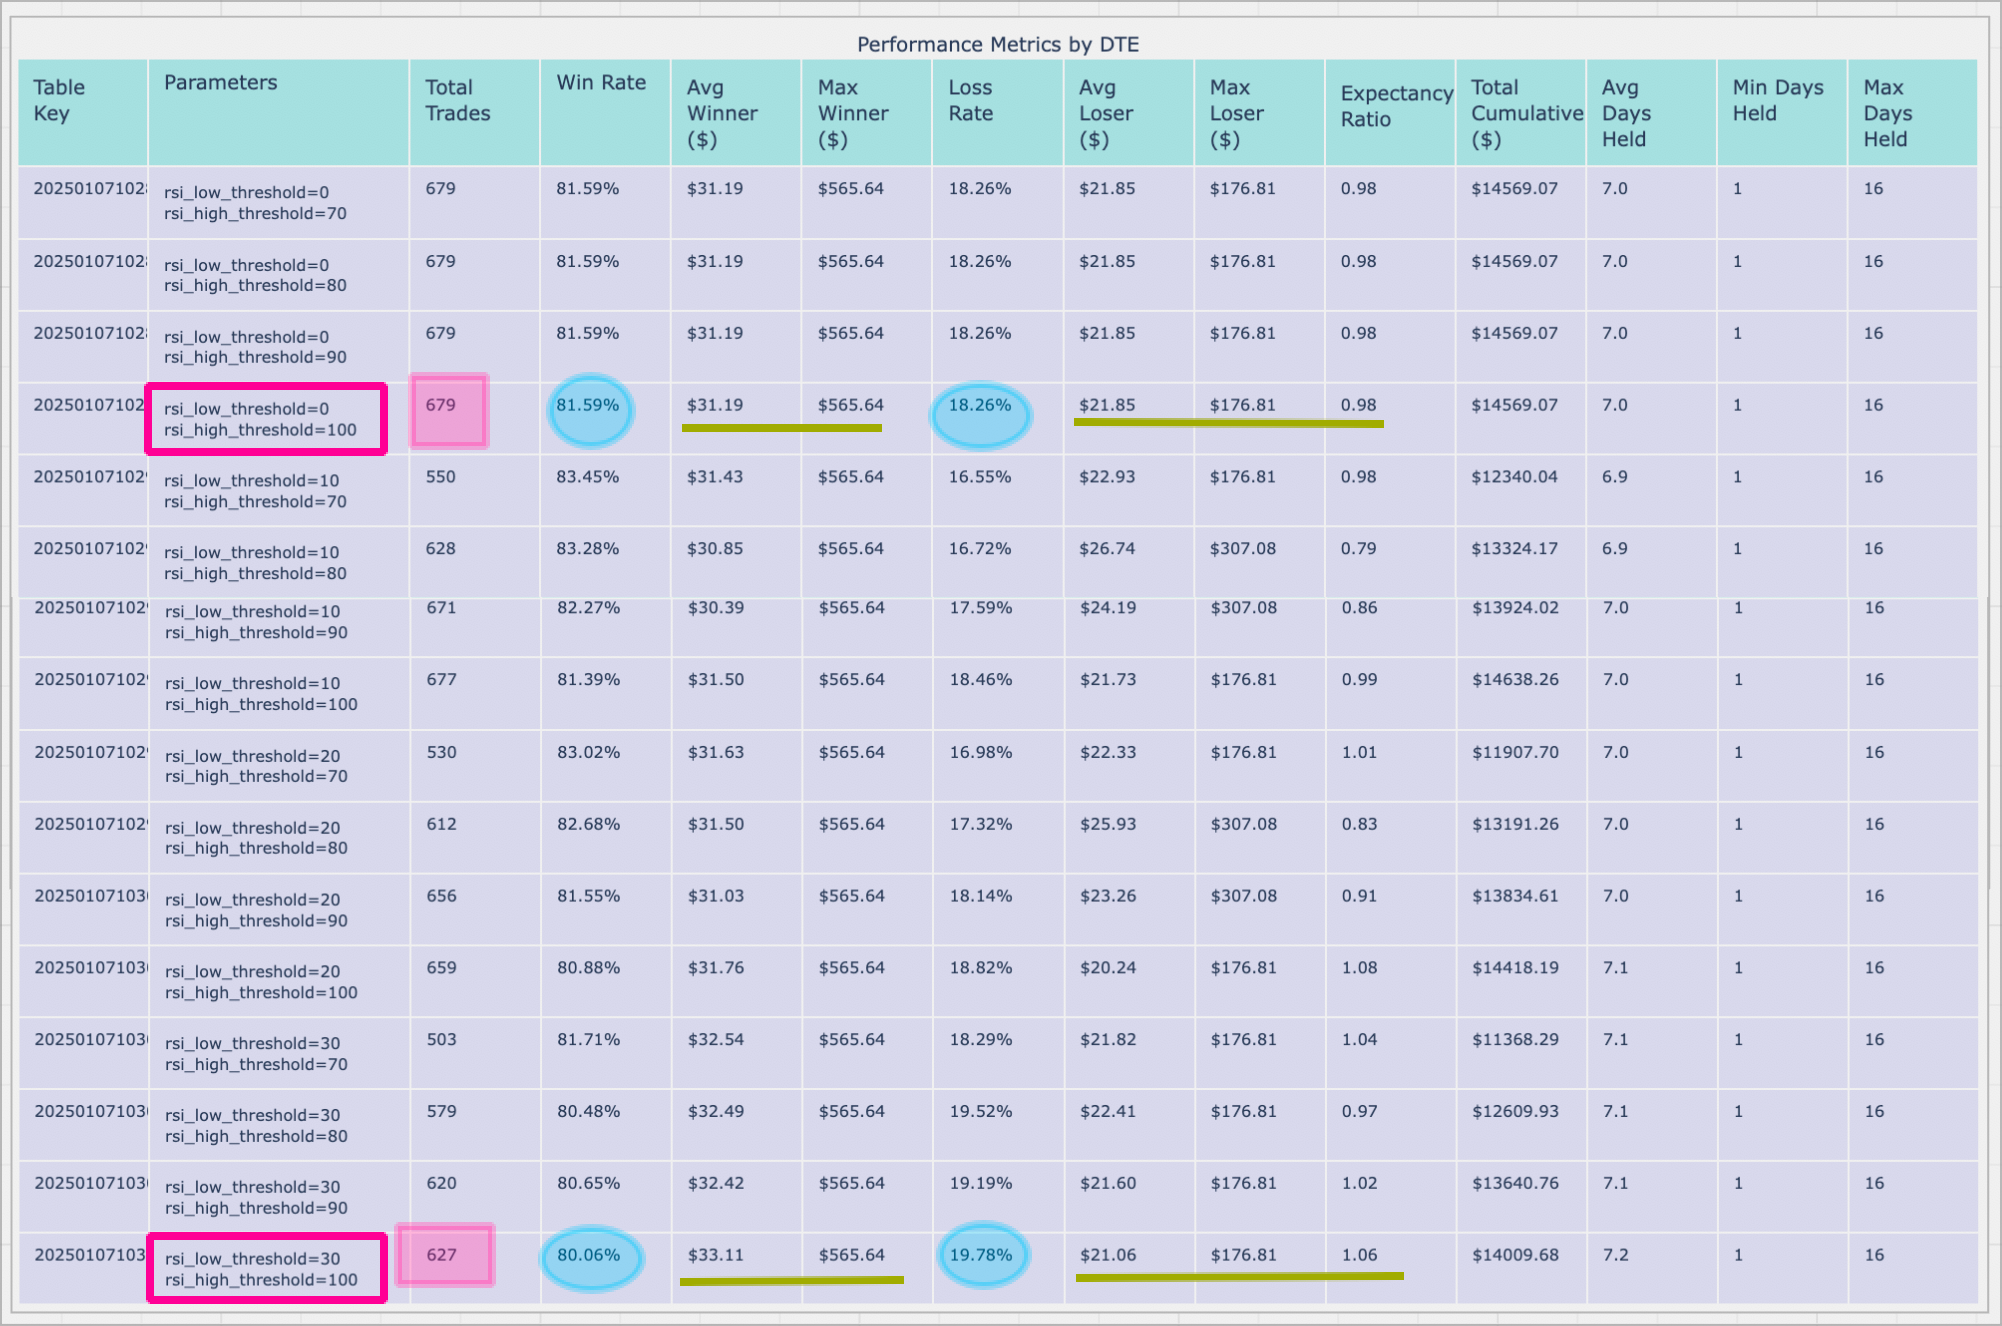
Backtest with different RSI thresholds and different RSI periods
RSI Thresholds:
RSI Period: 4

rsi_low_values=(0 10 20 30)
rsi_high_values=(70 80 90 100)

Best Parameters by Expectancy Ratio:
- rsi_low_threshold=20, rsi_high_threshold=100
Expectancy Ratio: 1.08
This combination shows the highest expectancy ratio, indicating it provides the best risk-adjusted returns. - rsi_low_threshold=30, rsi_high_threshold=100
Expectancy Ratio: 1.06
Second-best expectancy ratio. - rsi_low_threshold=30, rsi_high_threshold=70
Expectancy Ratio: 1.04
Third-best expectancy ratio.
Key Observations:
- It is worth not trading when RSI is oversold. It could be due to further downside movement or potential strong pull back which can put the trade at a losing position at the start.
- The overbought indicator doesn’t seem to have much impact.
Here is the breakdown by month
Note that these with 1 max position open at a time

In comparison, here is the monthly breakdown if we take trade regardless of market condition (No RSI Filter)

What if we compare 0-100, 30-100 with 5 max trades at once ?

Monthly breakdown with 5 trades at once:


Observations:
The drawdown during Covid period is better with the RSI 4 market filter but the always in strategy seems to perform better overall.
Testing it over a bunch of other RSI Periods
RSI Period: 3 5 7 9 11 13

rsi_low_values=(0 30)
rsi_high_values=(100)


In the end it does look like that keeping in trade all the trade is better than apply any RSI based filters. It is more likely due to missing the trades which is going to recover any losses incurred.